Satellites Sensors and Properties
Geostationary Orbit vs. Low Earth Orbit
All types of space satellites can be placed under three overarching categories, Low Earth Orbit (LEO), Medium Earth Orbit (MEO), and Geostationary orbit, also referred to as Geosynchronous Equatorial Orbit (GEO), satellites. The most common satellites supporting global development are in LEO, with GEO satellites being useful for weather monitoring and wildfire mapping.
Satellites in geostationary orbit circle above the Earth’s equator from west to east and do so at the same rate that the Earth spins, which allows them to remain constant over a fixed area of the Earth’s surface. To achieve geostationary orbit, these satellites must be further away from Earth which results in much lower spatial resolution compared to satellites in LEO. They make up for it with their high temporal resolution, as they are continuously imaging the same part of the Earth. GEO satellites are commonly used to image the Earth’s surface and atmosphere providing valuable insights into weather observation and oceanography. Recent advances in technology are improving the spatial resolution of satellites in GEO.
Much closer to the Earth relative to their counterparts, satellites in LEO image the Earth at a much higher spatial resolution. A common type of LEO satellite is a polar orbiting satellite which transits from north to south in orbit around the Earth. Sun-synchronous orbit is a particular kind of polar orbit which can allow a satellite to capture the Earth at roughly the same time every day. This is highly valuable for numerous applications that require data to monitor changes over time such as emergencies like forest fires or flooding to slow moving deforestation and rising sea levels1.
“Taskable” satellites, or satellites that can be directed to a specific location relative to its orbital path are becoming more common. These satellites are valuable for monitoring of dynamic areas like major metropolitan centers and conflict zones as they can be aimed at a specific location “on demand”. Tasking typically results in a higher cost when requesting a commercial company to capture a region at a specific time, as opposed to purchasing imagery that was captured as part of the constellations standard collection plan. New satellites companies such as Albedo are making on-demand tasking of areas core to their business model, offering resolution down to 10cm2.
Active vs. Passive
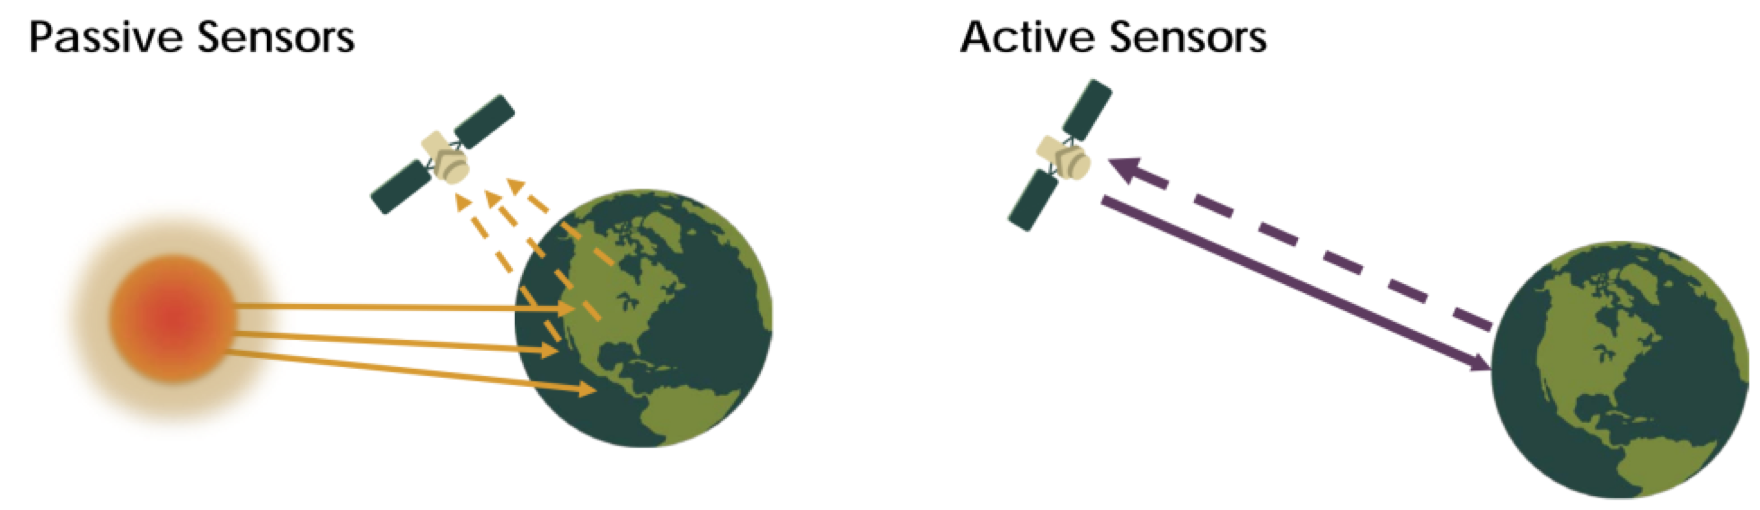
Sensors aboard satellites collect information about the Earth’s atmosphere and surface by measuring reflected energy. Passive sensors leverage solar energy and measure the electromagnetic radiation after it has been reflected off the Earth. Most passive systems operate in the visible, infrared, thermal infrared, and microwave portions of the spectrum. These are the most common form of high and medium-resolution Earth Observation satellites and measure land and sea surface temperatures, vegetation properties, cloud and aerosol properties, and other physical attributes. Passive sensors in the visible and near-infrared have trouble penetrating clouds thus have limitations in tropical and rainy climates3.
Active sensors generate their own source of energy, emitting and receiving an energy signal after it is reflected from the Earth. Active sensors include different types of radar sensors, altimeters, and lidar sensors. Most active sensors operate in the microwave band of the electromagnetic spectrum, which can penetrate clouds. These sensors are useful in measuring aerosols, forest structure, precipitation and wind, and sea surface topography among others3.
Optical Sensors
Optical remote sensing makes use of visible, near infrared and short-wave infrared sensors to form images of the earth’s surface by detecting the solar radiation reflected from targets on the ground4 (Passive Remote Sensing). Natural and synthetic materials reflect and absorb light differently at different wavelengths which allow objects to be differentiated by their spectral reflectance signatures. Optical remote sensing systems are classified into the following types, depending on the number of spectral bands used in the imaging process.
Panchromatic imaging system: The sensor is a single channel detector sensitive to radiation within a broad wavelength range. If the wavelength range coincide with the visible range, then the resulting image resembles a “black-and-white” photograph taken from space. The physical quantity being measured is the apparent brightness of the targets. The spectral information or “color” of the targets is lost. Nearly all high and medium-resolution satellites carry a panchromatic sensor along with a multispectral sensor, and the panchromatic band is often used to ‘pan-sharpen’ the multispectral image and lower the pixel size of the multispectral sensor. This practice is extremely commonplace and although it can impact the accuracy of the underlying pixel data for use in scientific studies, using a pan-sharpened image as a basemap or for use in feature extraction/object detection is common practice. Examples of panchromatic imaging systems are:
- IKONOS PAN
- SPOT HRV-PAN
Multispectral imaging system: The sensor is a multichannel detector with a few spectral bands. Each channel is sensitive to radiation within a narrow wavelength band. The resulting image is a multilayer image which contains both the brightness and spectral (color) information of the targets being observed. Examples of multispectral systems are:
- LANDSAT MSS
- LANDSAT TM
- SPOT HRV-XS
- IKONOS MS
Superspectral Imaging Systems: A superspectral imaging sensor has more spectral channels (typically >10) than a multispectral sensor. The bands have tighter bandwidths, enabling the finer spectral characteristics of the targets to be captured by the sensor. These systems are typically designed for use in vegetation detection and classification. Examples of superspectral systems are:
- MODIS
- MERIS
Hyperspectral Imaging Systems: A hyperspectral imaging system is also known as an “imaging spectrometer”. It acquires images in a hundred or more contiguous spectral bands.
The precise spectral information contained in a hyperspectral image enables better characterization and identification of targets. Hyperspectral images have potential applications in such fields as precision agriculture (e.g., monitoring the types, health, moisture status and maturity of crops), coastal management (e.g., monitoring of phytoplankton, pollution, bathymetry changes). An example of a hyperspectral system is:
- Hyperion on EO1 satellite
Synthetic Aperture Radar Sensors
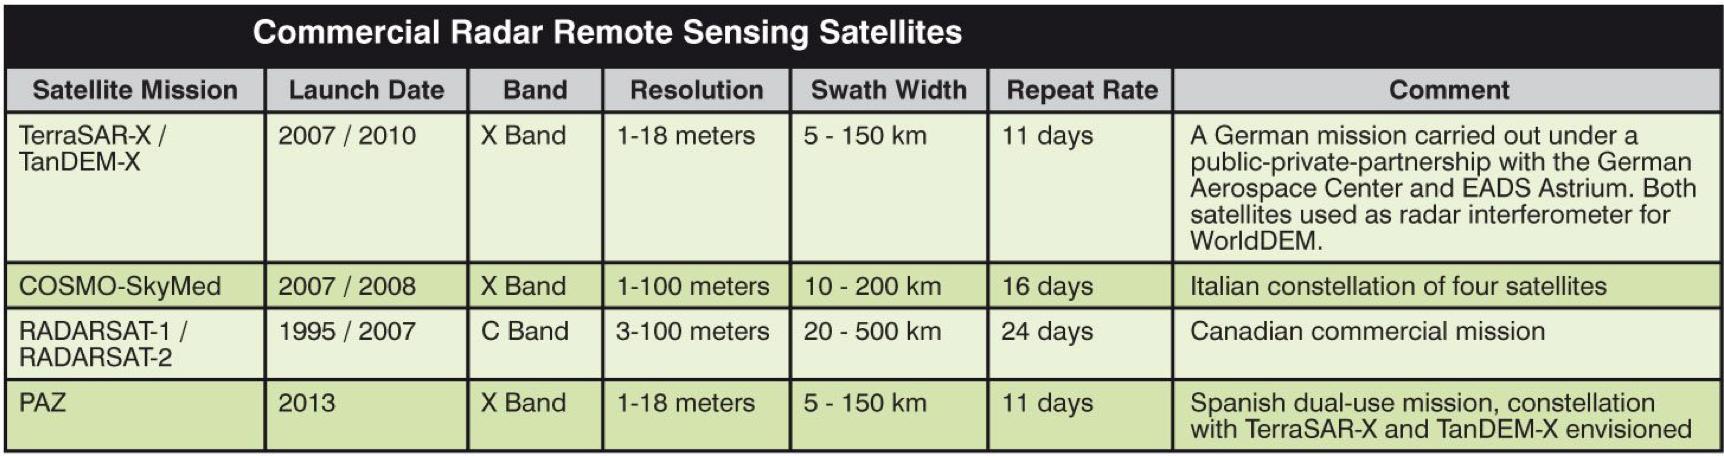
Synthetic Aperture Radar, or SAR, is a type of active data collection where a sensor produces its own energy and then records the amount of that energy reflected after interacting with the Earth. While optical imagery is similar to interpreting a photograph, SAR data require a different way of thinking since the signal is instead responsive to surface characteristics like structure and moisture. SAR can penetrate clouds, making it very valuable in situations where optical imagery is infeasible, including major fires and weather events5. SAR data used to be collected primarily by federal assets including ALOS-1, ALOS-2 and RADARSAT-2, but improvements in technology combined with an increase in the proliferation of satellite data has sparked an increase in commercial companies specializing in SAR data. One such company is Capella Space, which offers very high-resolution SAR data, ~50cm pixel size, which can be used for fine scale monitoring and fill a gap in the optical sensor space by enabling site monitoring during fires and hurricanes. See the following table for common radar bands and their use cases.
Band types in Commonly used in SAR
| Band | Frequency | Wavelength | Typical Application |
|---|---|---|---|
| Ka | 27-40 GHz | 1.1-0.8 cm | Rarely used for SAR (airport surveillance) |
| K | 18-27 GHz | 1.7-1.1 cm | rarely used (H20 absorption) |
| Ku | 12-18 GHz | 2.4-1.7 cm | rarely used for SAR (satellite altimetry) |
| X | 8-12 GHz | 3.8-2.4 cm | High resolution SAR (urban monitoring, ice and snow, little penetration into vegetation cover; fast coherence decay in vegetated areas) |
| C | 4-8 GHz | 7.5-3.8 cm | SAR Workhorse (global mapping; change detection; monitoring of areas with low to moderate penetration; higher coherence); ice, ocean maritime navigation |
| S | 2-4 GHz | 15-7.5 cm | Little but increasing use for SAR-based Earth observation; agriculture monitoring (NISAR will carry an S-band channel; expends C-band applications to higher vegetation density) |
| L | 1-2 GHz | 30-15 cm | Medium resolution SAR (geophysical monitoring; biomass and vegetation mapping; high penetration, InSAR) |
| P | 0.3-1 GHz | 100-30 cm | Biomass. First p-band spaceborne SAR will be launched ~2020; vegetation mapping and assessment. Experimental SAR. |
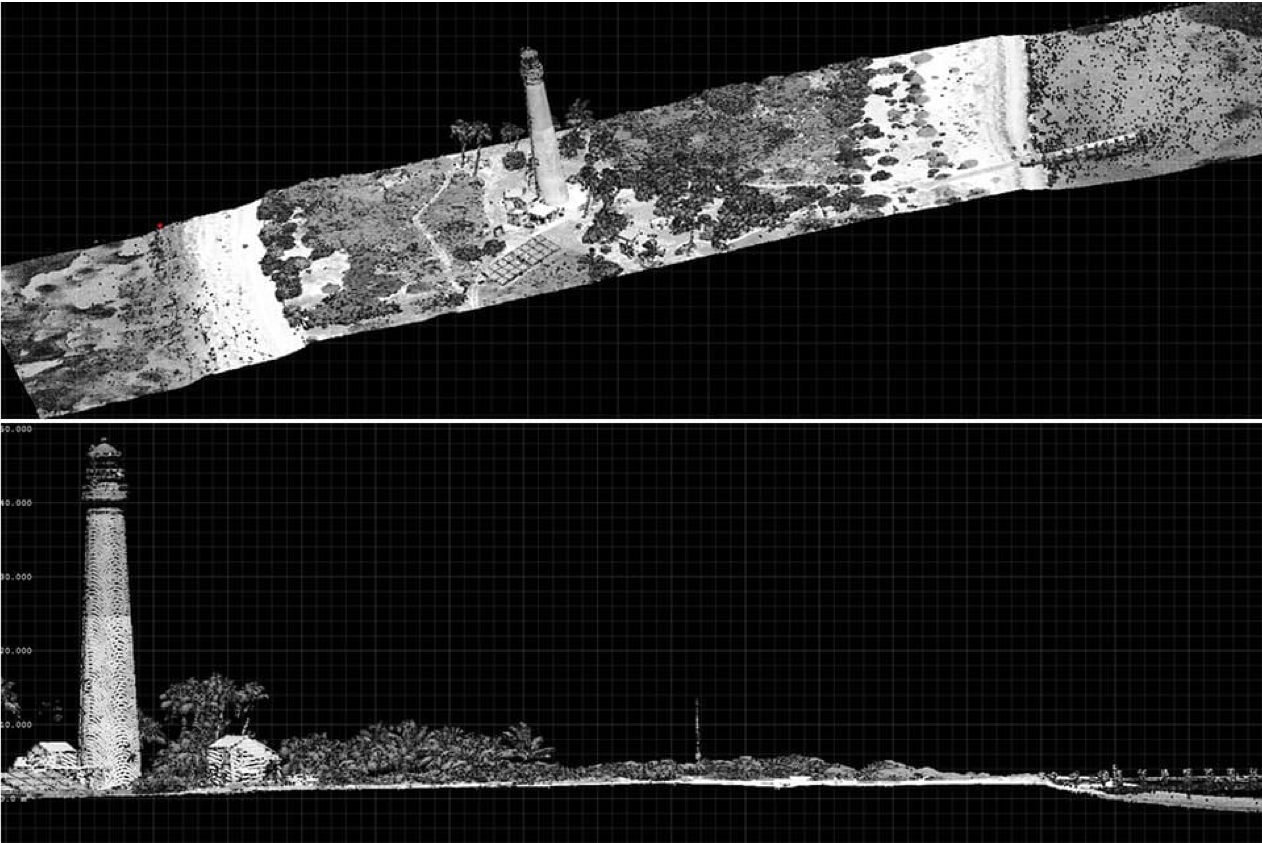
Lidar Sensors
Lidar, which stands for light detection and ranging, is a type of remote sensing method used to examine the surface of the earth. It uses a pulsed laser to measure distances to the Earth, generating precise three-dimensional information about the Earth and its surface characteristics. Common applications are inundation and storm surge modeling, shoreline mapping, digital elevation models (DEM), and various emergency response use cases. It is typically used by sensors on planes or drones rather than satellites.
Note on Aerial Imagery
All the above sensors are explained in the context of satellite imagery. Just as a satellite can carry an array of sensors and collect imagery from space, aerial aircraft such as drones and airplanes can carry the same sensors and image the Earth’s surface from a much lower altitude. Aerial and satellite data can offer similar data products and insights to the global development community, but both come with their limitations. Satellites can provide high temporal resolution over large swaths of the Earth’s surface by regularly revisiting the same area of the globe on a continuous basis. Once a satellite is in motion, it stays in motion and can continuously collect data for the lifespan of the satellite (which can be decades), making the imagery valuable and cost effective for change detection and large scale monitoring use cases. Aerial Imagery on the other hand offers incredible spatial resolution —up to 1-5 cm per pixel. The field of view covered in an aerial photograph is much smaller compared to satellite images and hyper specific to a mission or task. Aerial photography is great for more localized applications that make the most of this high spatial resolution. This complementary relationship between the two makes aerial and satellite data both powerful sources of useful geospatial information. Aerial imagery is oftentimes preferable to support the response to sudden onset-disasters results, for example weather events like hurricanes where planes and drones can be deployed to fly underneath the cloud cover that may still persist after the storm.
Aerial imagery can be collected from any aerial aircraft such as planes, helicopters, balloons, or drones. Increasingly common is the application of drones for aerial imagery collection for relatively cheap cost to planes, ability to fly close to the ground, and because they are unmanned. Drones do have significant range limitations, whereas planes and helicopters can travel over large distances and collect imagery from higher altitudes.
1) https://www.esa.int/Enabling_Support/Space_Transportation/Types_of_orbits
2) https://albedo.com/
3) https://www.earthdata.nasa.gov/learn/backgrounders/remote-sensing
4) https://crisp.nus.edu.sg/~research/tutorial/optical.htm
5) https://www.earthdata.nasa.gov/learn/backgrounders/what-is-sar