Analysis
Once imagery is collected and processed, it can then be visualized and analyzed in ways that brings out the critical information and insights that support your application. Satellites carrying the sensors explored in the previous section are measuring solar energy as it interacts with the Earth’s surface. This energy, whether visible to our eyes in the visual spectrum or invisible in the infrared or radar portions of the spectrum, contains a depth of information. There are a multitude of techniques that allow users to extract insights from this data. This section explores false color analysis, where various band combinations can, for example, make it easy to distinguish healthy from unhealthy vegetation from space. Mathematical calculations and spectral transformations take it one step further, allowing you to create normalized indices to quantify urbanization or monitor water quality. Recent innovations in cloud computing resources and analytical tools for working with big datasets are changing the way that we can analyze satellite data. The combination of new sensors, deeper archives, and better computing ability make it possible to draw sophisticated information from satellite imagery. In many cases, development partners can now process imagery in the cloud without having to invest in expensive hardware and software. This section explores these topics and others to enable you to get the most out of your satellite imagery.
Insights from invisible light
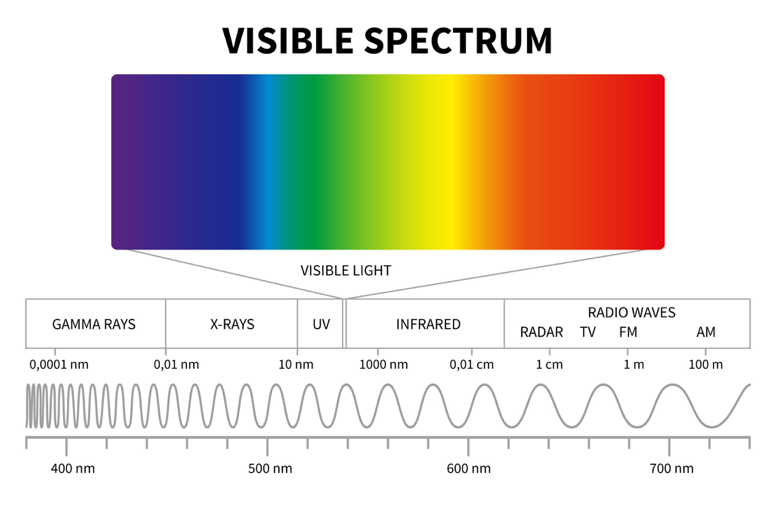
Most satellite data used in global development is measured by sensors that record energy within the electromagnetic spectrum. The electromagnetic spectrum ranges from the shorter wavelengths (including gamma and x-rays) to the longer wavelengths (including microwaves and broadcast radio waves). There are several regions of the electromagnetic spectrum which are useful for remote sensing.
The light which our eyes - our “remote sensors” - can detect is part of the visible spectrum. It is important to recognize how small the visible portion is relative to the rest of the spectrum. There is a lot of radiation around us which is “invisible” to our eyes but can be detected by other remote sensing instruments and used to our advantage. The visible wavelengths cover a range from approximately 0.4 to 0.7 µm. The longest visible wavelength is red and the shortest is violet1.
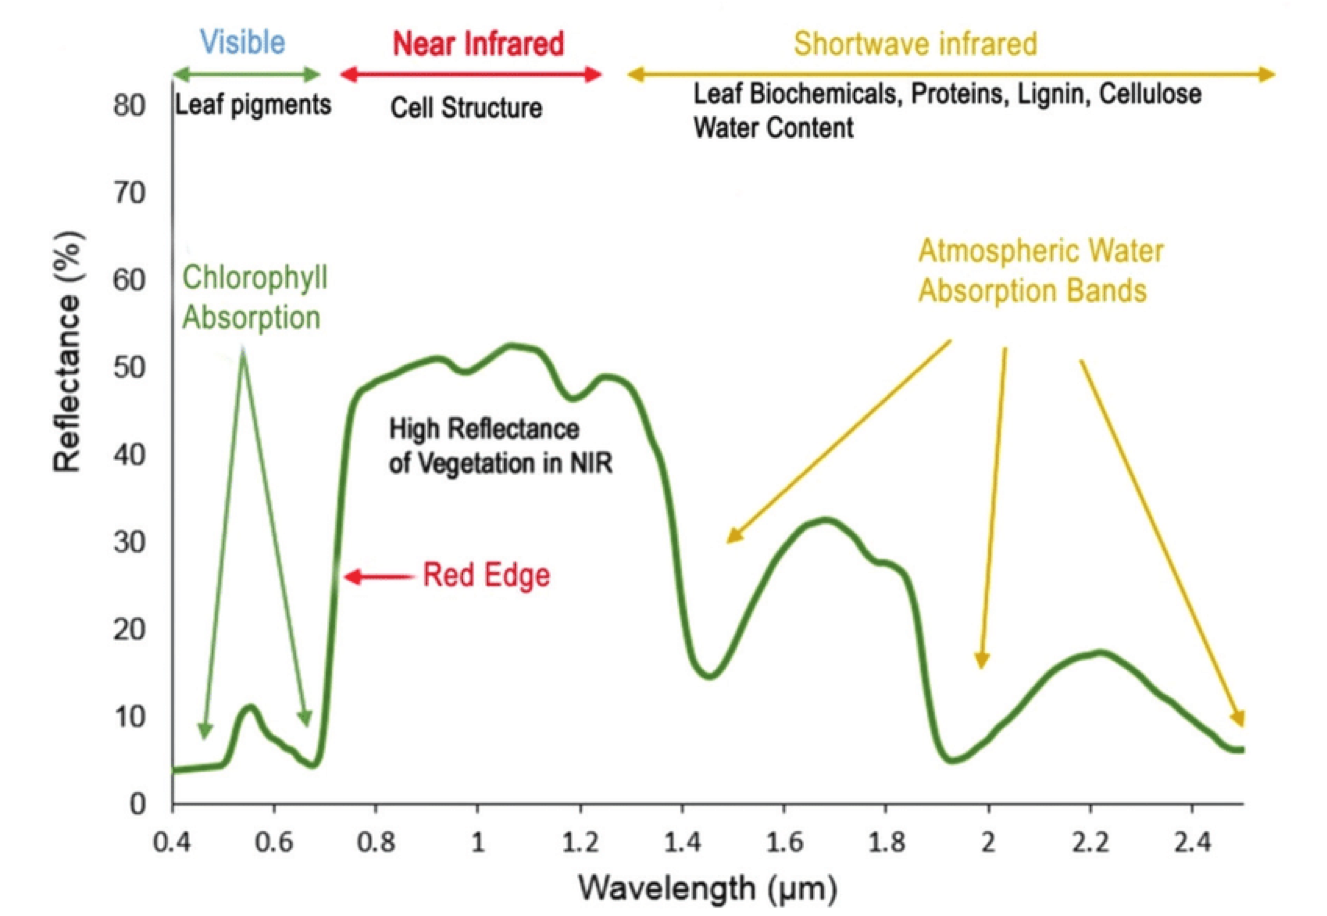
Many satellites measure light in wavelengths that are outside the range of human vision, such as infrared or ultraviolet light, that can help to understand the surface characteristics of the reflecting substances. Different objects reflect these light frequencies in different ways, and common satellite analysis techniques combine human-visible and invisible images (called “spectral bands”) to characterize their subjects. For example, spectral bands covering frequencies in the middle-infrared wavelength regions are responsive to moisture content in vegetation, forest canopy and soil, while near-infrared wavelength regions tend to emphasize vegetation health and— at a coarser scale— overall biomass. Spectral bands covering the ultraviolet portion of the spectrum are responsive to rocks and minerals, providing insight for mining and resource extraction. Taken together, the spectral response of each band creates a unique signature, referred to as its spectral curve or spectral signature. This signature can help to separate different types of land cover or derive information about the conditions within a single type of land cover.