Key Concepts
Remote sensing data undergoes significant processing to arrive at a recognizable image. Even then, there are a lot of possible processing levels that can be applied to satellite data ranging from a raw image to one that has been corrected for things such as terrain and atmospheric distortions. The data may also be available through different formats, or from different locations. It can be confusing which product is the right one to use, where the best place is to get it, or what format should be used. Below is some discussion about these key concepts that should help to demystify the process.
Units
For visualizing images, pixel values are often stretched from 0 to 255 to fit the range of displays. However, for analysis purposes it’s important to know the units of the underlying data values.
-
Digital Numbers (DN): Digital Numbers are the raw values stored by the satellite, often ranging from 0-255 or 0-65535, that need to be adjusted by a gain and offset to be translated to meaningful values. If the data is only available as Digital Numbers and no gain/offset is supplied, the data can be viewed, but it is not suitable for analysis.
-
Apparent Radiance: Radiance is a measure of the absolute brightness as observed at the sensor. Because sun illumination can change, and spectral bands can be different widths (wider band = more light), radiance is not a good measure for analysis. However, it can be converted to Top of Atmosphere (TOA) reflectance.
-
Top-Of-Atmosphere Reflectance (TOA): Reflectance is a number between 0 and 1 that represents how much energy within the spectral band, is reflected from it. Like apparent radiance, this is a measure of a pixel’s reflectance as observed, without correction for the atmosphere. TOA reflectance is often used for analysis as it tends to be ‘good-enough’ for many applications.
-
Surface-Leaving Radiance: This is the radiance leaving the ground. It is the apparent radiance corrected with an atmospheric model. It is also not suitable for analysis but can be converted to Surface Reflectance.
-
Surface Reflectance: This is similar to TOA reflectance but has also been corrected for atmospheric effects. While atmospheric correction is often preferred, it involves very complex processing that requires a lot of data input and as a result can be prone to error. Most users do not have the resources to run atmospheric models correctly so end up relying on TOA reflectance data. When available, this is the most suitable unit for analysis.
Processing levels and Analysis Ready Data
Satellite data providers often advertise data products as being processed to some level (e.g., Level 1, Level 1T, Level 2GT). See the Typical serviced image section for more information. Unfortunately, there is no accepted standard for what the different levels are. Typically, a Level 0 image represents raw satellite data, a Level 1 image has some radiometric and geometric corrections applied, and a Level 2 image has been atmospherically corrected.
Image Clipping: Imagery is clipped and catered to a specific location of interest, avoiding the need to download extremely large datasets that are not needed in analysis.
Geo-registered: Individual pixels can be trusted to be aligned well with the actual earth, such that the geo-location accuracy is within a pixel.
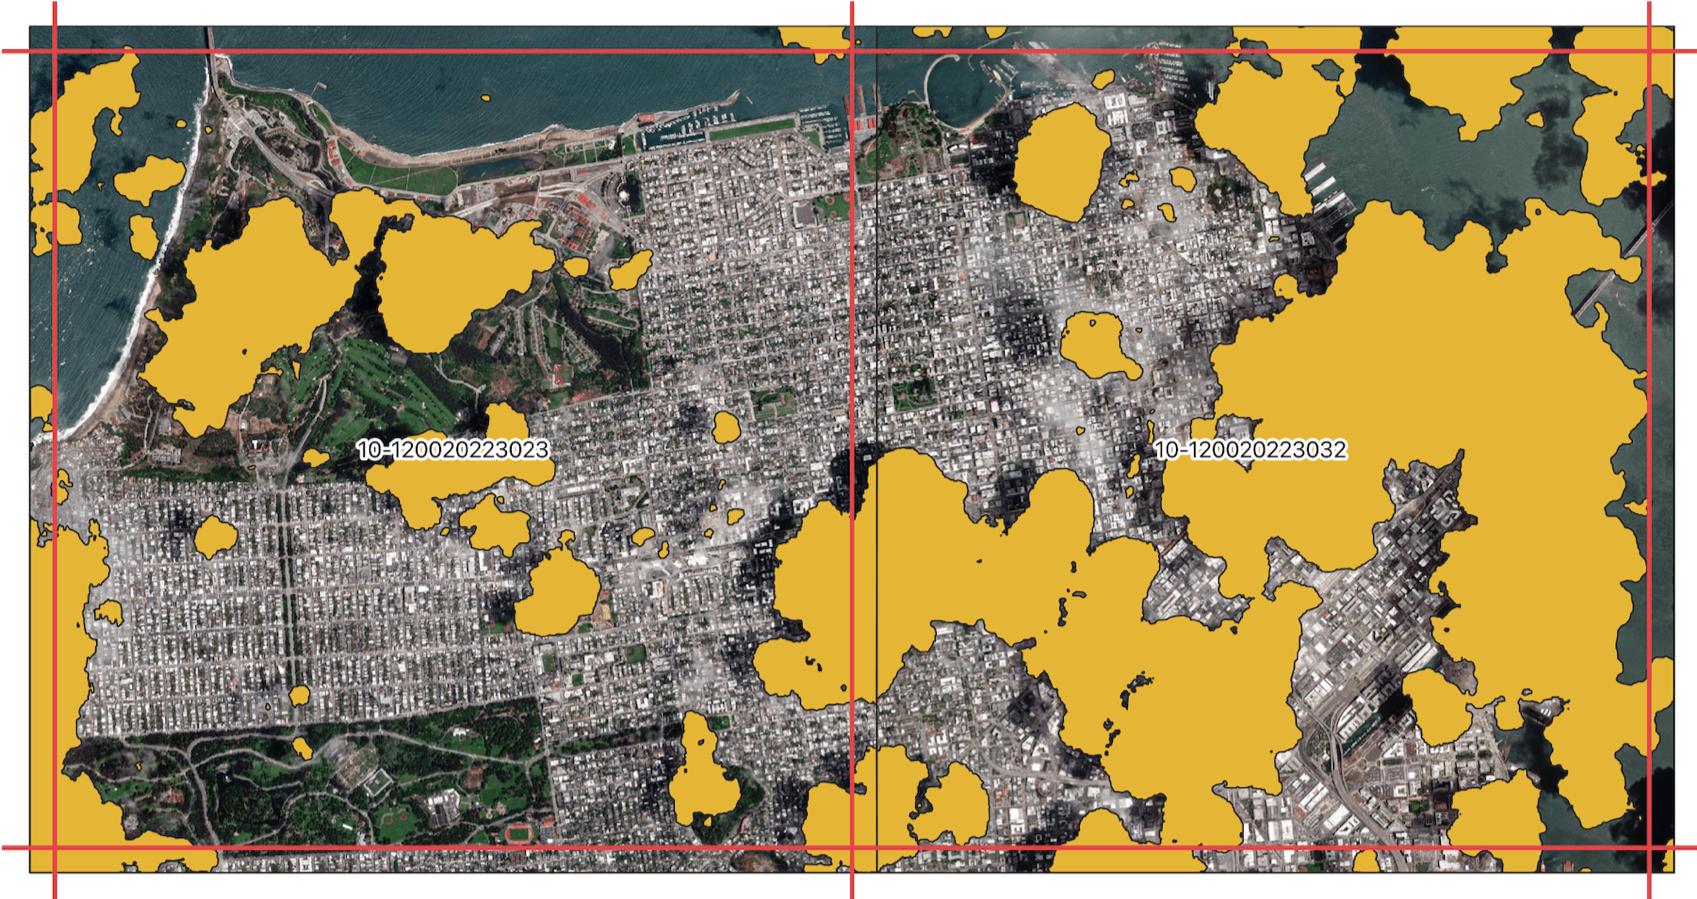
Data Masks: Masks are available for indicating pixels that have clouds, shadows, or potentially some sensor issues (e.g., bad pixel). Masks can also be applied depending on the application to mask out noisy or un-necessary data.
Analysis Ready Data (ARD): Recently, providers have been offering ‘Analysis Ready Data’. The amount of data preparation varies across the industry, but it is generally agreed that it will be prepared for a user to analyze with the following pre-processing steps already conducted on the imagery.
Using Analysis Ready Data, users can more easily perform reliable and consistent analyses, like creating accurate time series for a region. Proper geo-location allows them to trust that pixels across time frames line up, the masks allow them to drop bad data, and surface reflectance allows for a comparison across scenes without worry of atmospheric variations over time.
Pansharpening: Some sensors take images of lower resolution in many bands (e.g. Multispectral red, green and blue for a color image), and then have another channel with much wider spectral range (i.e. “panchromatic”) with finer resolution. By means of a mathematical relation, it is possible to increase the resolution of the multispectral bands with the higher resolution panchromatic band.
Pan-sharpened imagery does not add information but can be useful for images that are primarily for human viewing purposes.
Accuracy: Accuracy refers to the possible difference between the reported locations on the images and their actual location in the real world. A usual standard is a 90% likelihood within a Circular Area around the location, known as CE90 (Circular Error-90). To ensure accuracy, satellite images are ortho-rectified for orthography with either an elevation model or using Ground Control Points (GCP).
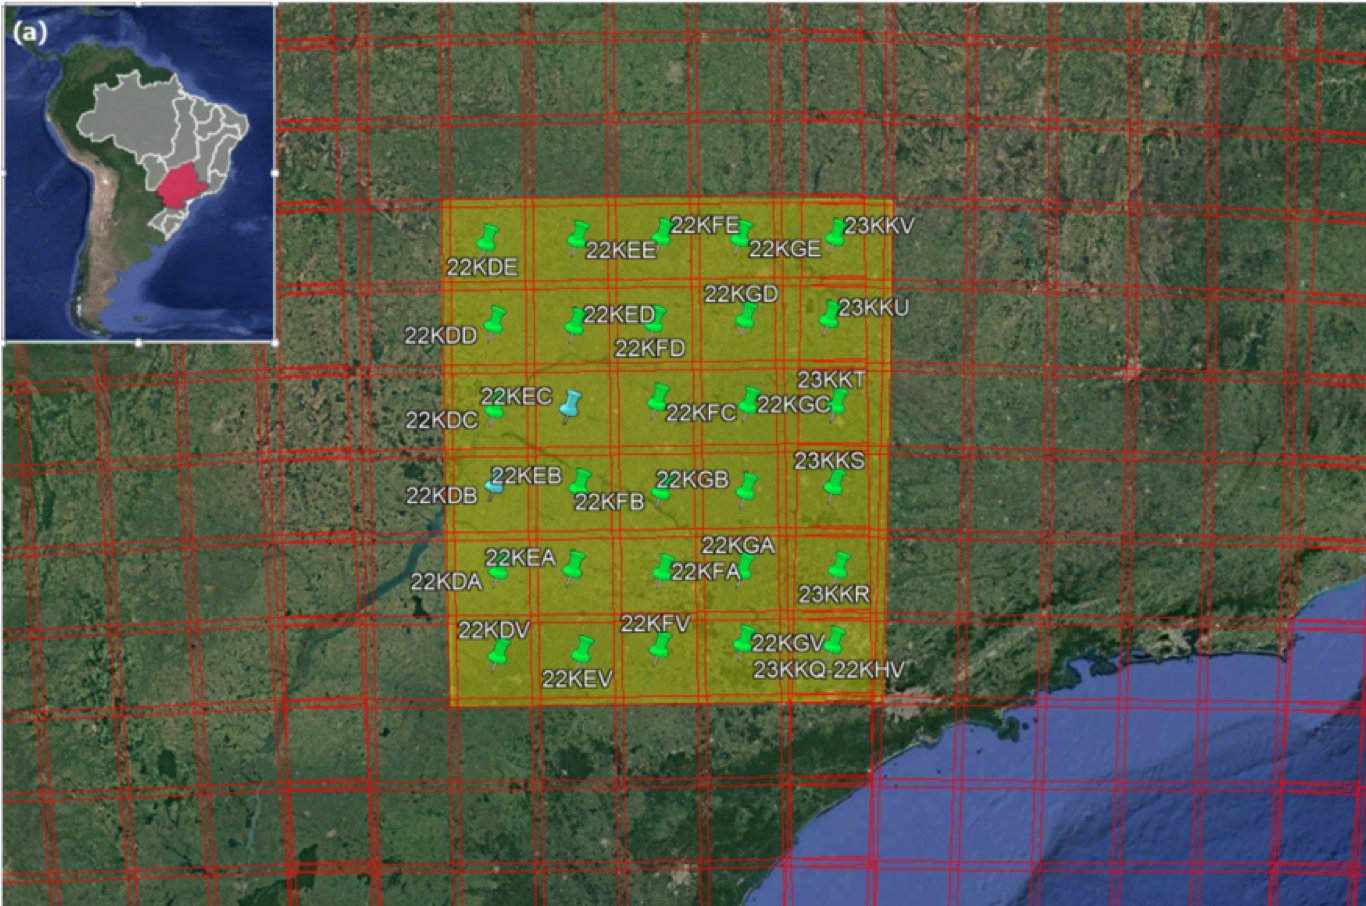
Image Strips
Individual collections of satellite imagery are often referred to as ‘image strips’. These images represent a single snapshot in time with an exact collection point and time made by a single sensor/satellite. These data are typically captured as part of a global content plan and as such are designed to capture a dynamic environment, like a major metropolitan area, and/or are timed to minimize effects from seasonal changes like monsoon season. Because of the varying nature of weather patterns across the globe there is always the potential issue of an image containing clouds and haze that cause distortion or make an image completely unusable. When an image collection is made upon request, often referred to as ‘tasking’, it is likely there will be off nadir impacts to the image as the sensor has to be directed to a specific area of interest. In the case of most commercial satellite providers, they have a fleet of satellites with different spatial and spectral resolutions, which means that images from the different sensors will carry unique metadata specific to the given satellite and collection time/angle.
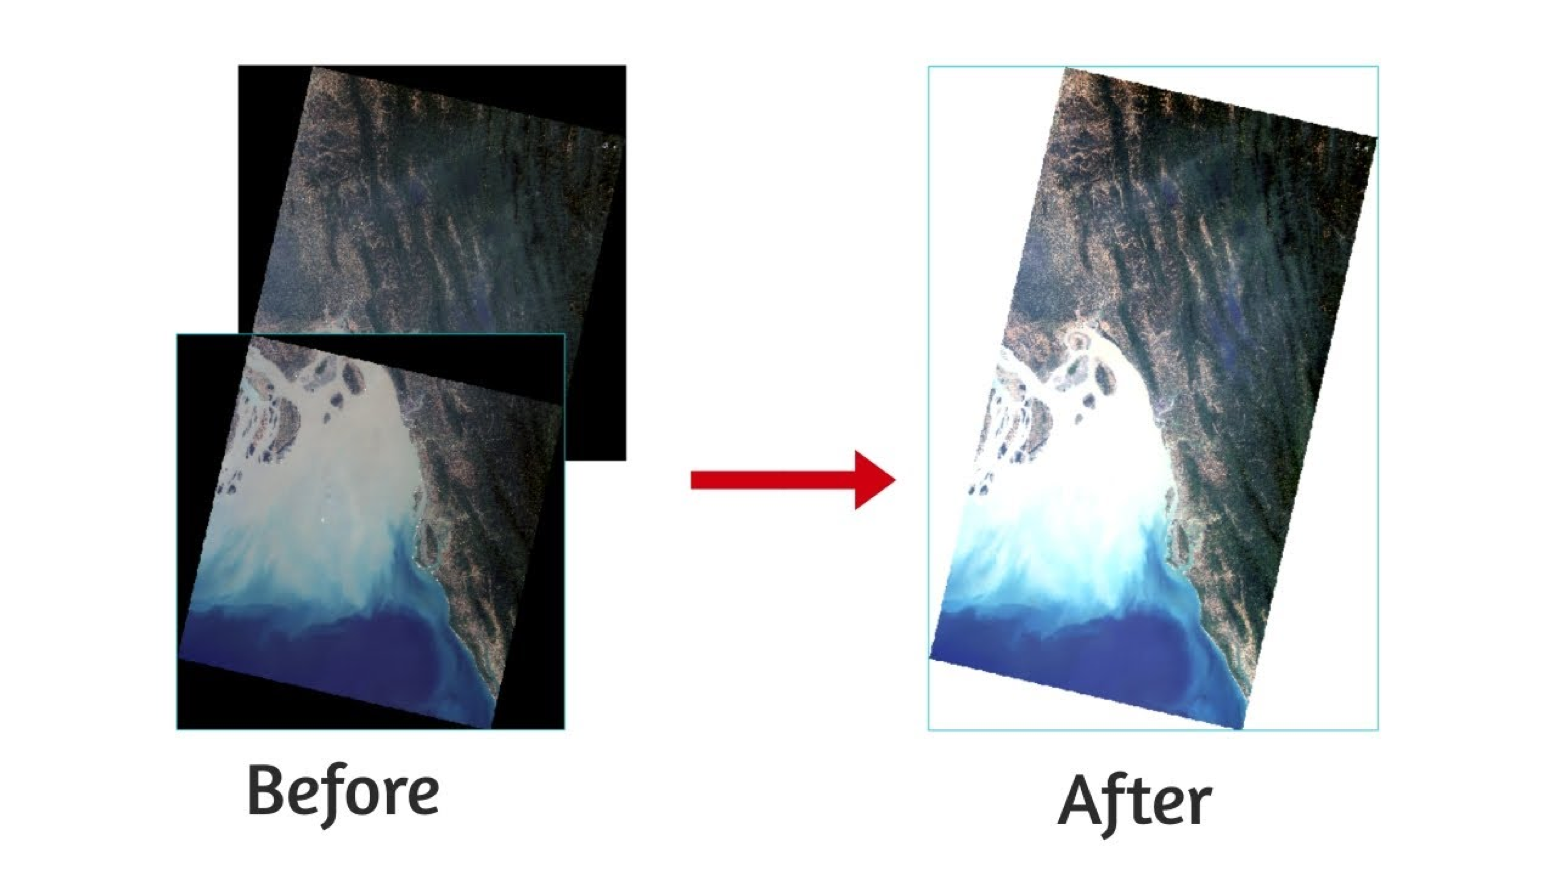
Image Mosaics
Imagery mosaics are composites of at least two, up to several hundred image strips that have been combined to create a clear picture of a given area. Mosaics have the added benefit of having a consistent resolution, minimal or no cloud cover/haze, and reduced off nadir angles. These image composites are often created by the imagery provider but can also be generated by data purchasers such as Google and Apple. Due to consistent image quality, mosaics are often used as base maps in common tools like Google Maps and OpenStreetMap. These data are also common inputs in machine learning models as the model developers must contend with fewer issues resulting from dynamic image quality. Even with the added benefit of having a consistent input for image analysis, there are drawbacks such as a wide range of collection dates/times. The varying collection dates are a result of the image selection process, which oftentimes favors image quality over currency.
One of the biggest challenges when dealing with remote sensing data is the presence of clouds. Even if the clouds, and cloud shadows, have been masked properly, it is difficult to work with images that have gaps of data missing throughout the scene. Areas that may have been covered with clouds in one area of the AOI can be filled with good data from another day when there was no cloud cover. Mosaicking creates a continuous image that is both easy to look at and simple to use. The mosaic could include data over weeks, months, or even a year.
However, the process of creating the mosaic also removes an important piece of information - the precise date when the data is collected. This temporal information is vital for some applications where changes can happen on timescales shorter than the time period of the mosaic. A mosaic using a years’ worth of imagery is not very useful in visualizing seasonal changes or shifts in growing seasons, but it is hugely helpful when trying to have a cloud-free visualization of a city, state, or country. Mosaics are commonly used as ‘basemaps’, with common types including what is found in Google Satellite view and different OSM basemap layers.
When using mosaics, as with the original scenes, it is important to know what units the data is provided in. Mosaics are frequently created for visual applications, such as the creation of a basemap. For this, different scenes might have been color corrected or otherwise transformed to create a more visually pleasing image. These are not as suitable for analysis purposes.
Data Formats
Data providers options when publishing data. It’s not just what file format to use (e.g., tif, jpg, txt, csv, json), but also how the data is divided across folders. This has traditionally involved trade-offs between ease of use and file sizes. If data is split up across lots of files, then users need to download and manage many files. Alternately, if the data is consolidated into fewer files, then the user may be forced to download more data than needed.
Consider a user downloading a single Landsat-8 scene using EarthExplorer. The entire scene, with all bands, is a 1 GB compressed file. The scene includes all 11 spectral bands for a region covering 68,000 km2. If the user is interested in just the Red and Near-Infrared bands for a region of 1000 hectares, they are using much less than 1% of the data they are required to download.
Alternatively, it is possible to store the data in a format a user can read any arbitrary piece of the data remotely, without having to download bytes that will not be used. Several file formats can provide this functionality, but the most widely used and accepted is what is called a Cloud-Optimized GeoTIFF (COG). A COG has several important features:
-
Internally tiled: Internally, data is stored in smaller tiles. This enables efficient reads when reading just a portion of the image.
-
Internal File Directory (IFD): An IFD is stored in the header of every GeoTIFF and is a directory of byte locations in the image. This allows clients to read the header and get the precise byte locations.
-
Overviews: Sometimes users do not need images at their full resolution. By providing reduced resolution overviews with the data the data can be accessed much faster.
Image Catalogs and Searching
Finding and acquiring the necessary satellite imagery is not as simple as it may first seem. Every data provider uses their own unique catalog for inventorying their data, using their own field names and conventions. If they have an API, this too will be unique. This can become confusing for human users, and further it is difficult if not impossible to create software clients that can be used across catalogs from different data providers.
The SpatioTemporal Asset Catalogs (STAC) specification is a common language to describe geospatial information, so it can more easily be worked with, indexed, and discovered. There are exabytes of spatial data in existence today, but most of it remains inaccessible. It is in a myriad of different formats, with no common way to find relevant information about a place over time. The goal of STAC is to enable a global index of all imagery (satellite, aerial, drone, etc), derived data products and alternative geospatial captures (LiDAR, SAR, Full Motion Video, Hyperspectral and beyond). STAC focuses on an easily implementable standard for organizations to expose their data in a persistent and reliable way.